Part 3: How to Analyze a Database File with GPT-3.5

In part 3 of this blog series, we'll explore the proper usage of data analysis with ChatGPT-3.5 and how you can analyze and visualize data from a SQLite database to help you make the most of your data.  

Suppose we have a database file for a gold broker company that sells gold and we want to analyze the total monthly sales for each product. What do we do and what is the logical question to understand that gold.db?
 

Tools You Will Need

The first step

Open the gold.db file in the database browser (SQLite DB Browser) and copy the database schema information:

  • CREATE TABLE Customer ( CustomerID INTEGER PRIMARY KEY AUTOINCREMENT, FirstName TEXT, LastName TEXT, Email TEXT, Phone TEXT, Address TEXT, RegistrationDate DATE );

  • CREATE TABLE OrderDetails ( OrderDetailID INTEGER PRIMARY KEY AUTOINCREMENT, OrderID INTEGER, ProductID INTEGER, Quantity INTEGER, PriceAtTimeOfPurchase REAL, FOREIGN KEY (OrderID) REFERENCES Orders(OrderID);

  • Updated reference FOREIGN KEY (ProductID) REFERENCES Product(ProductID) ); CREATE TABLE Orders ( OrderID INTEGER PRIMARY KEY AUTOINCREMENT, CustomerID INTEGER, OrderDate DATE, Status TEXT, FOREIGN KEY (CustomerID);

  • REFERENCES Customer(CustomerID) ); CREATE TABLE Product ( ProductID INTEGER PRIMARY KEY AUTOINCREMENT, ProductName TEXT, MetalType TEXT, Form TEXT, Weight REAL, Purity REAL, StockQuantity INTEGER, PricePerUnit REAL );

  • CREATE TABLE Supplier ( SupplierID INTEGER PRIMARY KEY AUTOINCREMENT, SupplierName TEXT, Contact TEXT, Email TEXT, Phone TEXT ); CREATE TABLE Supply ( SupplyID INTEGER PRIMARY KEY AUTOINCREMENT, SupplierID INTEGER, ProductID INTEGER, SupplyDate DATE, Quantity INTEGER, PricePerUnit REAL, FOREIGN KEY (SupplierID) REFERENCES Supplier(SupplierID), FOREIGN KEY (ProductID) REFERENCES Product(ProductID);
     

The second step

Write the following question in ChatGPT!

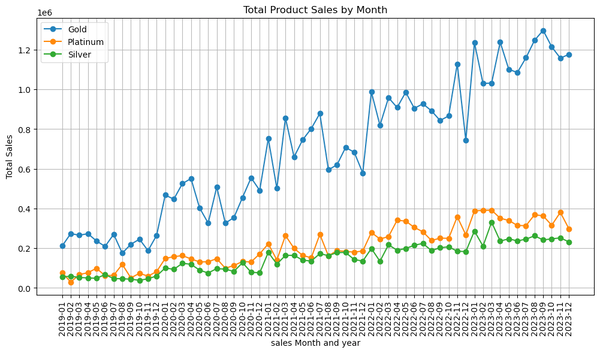
You are a data engineer and have a sqlite3 database with the following schema. You should write a python script that you can run in a Jupyter Notebook that should draw a diagram. The data in the database comes from sales of a gold broker company. Build a chart that shows total sales of products by month as well as group sales by product types.

Database schema:

CREATE TABLE Customer ( CustomerID INTEGER PRIMARY KEY AUTOINCREMENT, FirstName TEXT, LastName TEXT, Email TEXT, Phone TEXT, Address TEXT, RegistrationDate DATE ); CREATE TABLE OrderDetails ( OrderDetailID INTEGER PRIMARY KEY AUTOINCREMENT, OrderID INTEGER, ProductID INTEGER, Quantity INTEGER, PriceAtTimeOfPurchase REAL, FOREIGN KEY (OrderID) REFERENCES Orders(OrderID), -- Updated reference FOREIGN KEY (ProductID) REFERENCES Product(ProductID) ); CREATE TABLE Orders ( OrderID INTEGER PRIMARY KEY AUTOINCREMENT, CustomerID INTEGER, OrderDate DATE, Status TEXT, FOREIGN KEY (CustomerID) REFERENCES Customer(CustomerID) ); CREATE TABLE Product ( ProductID INTEGER PRIMARY KEY AUTOINCREMENT, ProductName TEXT, MetalType TEXT, Form TEXT, Weight REAL, Purity REAL, StockQuantity INTEGER, PricePerUnit REAL ); CREATE TABLE Supplier ( SupplierID INTEGER PRIMARY KEY AUTOINCREMENT, SupplierName TEXT, Contact TEXT, Email TEXT, Phone TEXT ); CREATE TABLE Supply ( SupplyID INTEGER PRIMARY KEY AUTOINCREMENT, SupplierID INTEGER, ProductID INTEGER, SupplyDate DATE, Quantity INTEGER, PricePerUnit REAL, FOREIGN KEY (SupplierID) REFERENCES Supplier(SupplierID), FOREIGN KEY (ProductID) REFERENCES Product(ProductID).

The answer will be as follows in ChatGPT (code)

import sqlite3
import pandas as pd
import matplotlib.pyplot as plt

# Step 1: Connect to the SQLite database
db_connection = sqlite3.connect('your_database.db')  # Replace 'your_database.db' with the actual database file path

# Step 2: Query the database to retrieve the required data
query = """
    SELECT
        strftime('%Y-%m', o.OrderDate) AS Month,
        p.MetalType AS ProductType,
        SUM(od.Quantity * od.PriceAtTimeOfPurchase) AS TotalSales
    FROM Orders o
    JOIN OrderDetails od ON o.OrderID = od.OrderID
    JOIN Product p ON od.ProductID = p.ProductID
    GROUP BY Month, ProductType
    ORDER BY Month
"""

# Execute the query and fetch the data into a Pandas DataFrame
df = pd.read_sql_query(query, db_connection)

# Step 3: Pivot the data for plotting
pivot_df = df.pivot(index='Month', columns='ProductType', values='TotalSales')
pivot_df.fillna(0, inplace=True)

# Step 4: Create the line chart using Matplotlib
plt.figure(figsize=(12, 6))
for product_type in pivot_df.columns:
    plt.plot(pivot_df.index, pivot_df[product_type], marker='o', linestyle='-', label=product_type)
    

plt.xlabel('sales Month and year')
plt.ylabel('Total Sales')
plt.title('Total Product Sales by Month')
plt.legend(loc='upper left')
plt.grid(True)

# Rotate x-axis labels for better readability
plt.xticks(rotation=90)

plt.show()

# Close the database connection
db_connection.close()

The third step

Copy the code as it is, but you have to change the path to the gold.db file inside the brackets.

('your_database.db')
 

The fourth step

Open the Jupiter Notebook, paste the code and run it … .


The result will be as it follows:

Conclusion

ChatGPT can be a game-changer in the field of data analysis, offering a valuable resource for generating insights, explanations, and visualizations. By leveraging this advanced AI model, you can streamline your data analysis process, enhance your decision-making, and unlock the potential of your data.

Remember that while ChatGPT can assist with data analysis, it's most effective when used in conjunction with human expertise and a comprehensive understanding of your data. With the right approach, ChatGPT can be a powerful ally in your quest for data-driven insights.

Blog 11/10/23

Part 1: Data Analysis with ChatGPT

In this new blog series we will give you an overview of how to analyze and visualize data, create code manually and how to make ChatGPT work effectively. Part 1 deals with the following: In the data-driven era, businesses and organizations are constantly seeking ways to extract meaningful insights from their data. One powerful tool that can facilitate this process is ChatGPT, a state-of-the-art natural language processing model developed by OpenAI. In Part 1 pf this blog, we'll explore the proper usage of data analysis with ChatGPT and how it can help you make the most of your data.

Blog 11/27/23

Part 4: Save Time and Analyze the Database File

ChatGPT-4 enables you to analyze database contents with just two simple steps (copy and paste), facilitating well-informed decision-making.

Blog 11/14/23

Part 2: Data Analysis with powerful Python

Analyzing and visualizing data from a SQLite database in Python can be a powerful way to gain insights and present your findings. In Part 2 of this blog series, we will walk you through the steps to retrieve data from a SQLite database file named gold.db and display it in the form of a chart using Python. We'll use some essential tools and libraries for this task.

Blog 3/12/21

Introduction to Web Programming in F# with Giraffe – Part 3

In this series we are investigating web programming with Giraffe and the Giraffe View Engine plus a few other useful F# libraries.

Blog 7/15/21

Building a micro frontend consuming a design system | Part 3

In this blopgpost, you will learn how to create a react application that consumes a design system.

Blog 9/15/22

Introduction to Functional Programming in F# – Part 3

Dive into F# data structures and pattern matching. Simplify code and enhance functionality with these powerful features.

Headerbild zu Datenbanken mit Open Source
Technologie 11/12/20

Databases with Open Source

Every dynamic application needs some form of database to store its data logically and sorted. However, there is no one-size-fits-all solution, but it should always be looked at the use case to make the appropriate choice.

Blog 9/17/21

How to gather data from Miro

Learn how to gather data from Miro boards with this step-by-step guide. Streamline your data collection for deeper insights.

Service

Spend Management Consulting

Our team of spend management experts can help you analyze, optimize and control your IT spend.

Blog 3/10/21

Introduction to Web Programming in F# with Giraffe – Part 1

In this series we are investigating web programming with Giraffe and the Giraffe View Engine plus a few other useful F# libraries.

Blog 3/11/21

Introduction to Web Programming in F# with Giraffe – Part 2

In this series we are investigating web programming with Giraffe and the Giraffe View Engine plus a few other useful F# libraries.

Service

Training courses on how to deploy target software

Do you want to maintain the software for your idea and innovation management yourself? We will be happy to provide you with the necessary know-how in our training courses.

Leistung

Digital Consulting International

For us, consulting means working with you to achieve your goals, show you new options and get the most out of your resources and requirements..

Die Videokonferenzlösung von Google Workspace Meet
Service

Workspace Security Assessment

Two of the most common topics for questions about Cloud services in general, and Google Workspace in particular, are security and data protection.

Blog

Data-Driven Government: 3 Keys to Digital Transformation

How data portals, steering teams, and empowered agencies can drive a smarter, faster, and more transparent public sector—three strategic pillars for modern government.

Referenz

The digital customer file with IBM Content Manager

The prefabricated house specialist SchwörerHaus KG has relied on IBM technology for many years to set up a digital customer file.

Mit Google Workspace ist jeder richtig in der Cloud
Produkt

Digital workplace - overview

Well prepared into the Cloud! The right mix of hardware and software makes the experience so much more enjoyable. Here you can find an overview of our most important tools!

Blog

Responsible AI: A Guide to Ethical AI Development

Responsible AI is a key requirement in the development and use of AI technologies. You can find everything you need to know here!

Blog 12/22/23

ADRs as a Tool to Build Empowered Teams

Learn how we use Architecture Decision Records (ADRs) to build empowered, autonomous teams, enhancing decision-making and collaboration.

Blog 9/13/22

Introduction to Functional Programming in F# – Part 2

Explore functions, types, and modules in F#. Enhance your skills with practical examples and insights in this detailed guide.

Bleiben Sie mit dem TIMETOACT GROUP Newsletter auf dem Laufenden!