
Executive summary
This report comprehensively analyzes the auto parts sales database for(Automobile Spare Parts Sales). The primary focus is understanding sales trends, identifying high-performing products, Analyzing the most profitable products for the upcoming quarter, and evaluating inventory management efficiency. Key findings indicate strong demand for specific spare parts categories, varying sales patterns over time, and opportunities to improve inventory levels. Recommendations are provided to enhance sales and inventory management strategies.
Introduction
This report examines the sales data of [Automobile Spare Parts Sales]'s automobile spare parts database. The analysis covers data from (01.01.2030) to (31.12.2039), providing insights into sales performance, customer behaviour, and inventory management.
Objectives
1) Identify trends in spare parts sales. to evaluate the performance of different products.
-
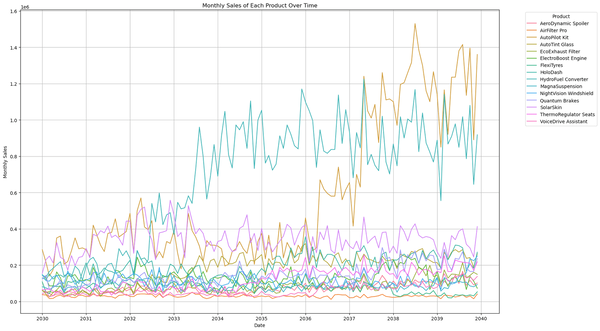
Monthly Sales of Each Product Over Time.
-
Monthly Profit of Each Product Over Time.
-
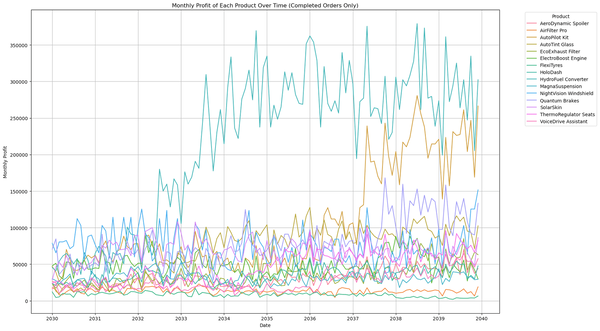
Monthly Profit of Each Product Over Time (Completed Orders Only).
-
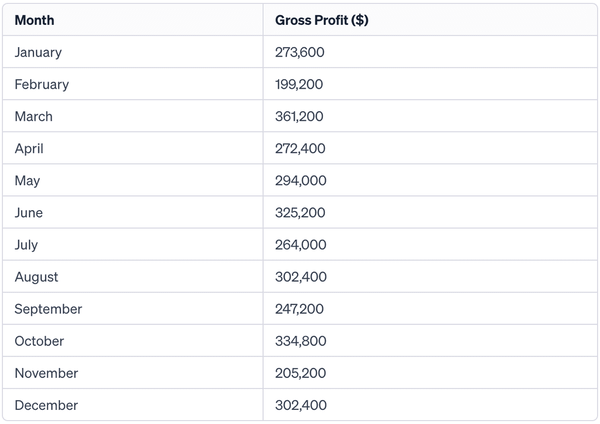
Monthly Gross Profit for (Hydro Fuel Converter) in 2039.
-
Monthly Profit of Each Product Over Time in CSV file format.
2) Predictive analysis of data using sales history For the past year.
-
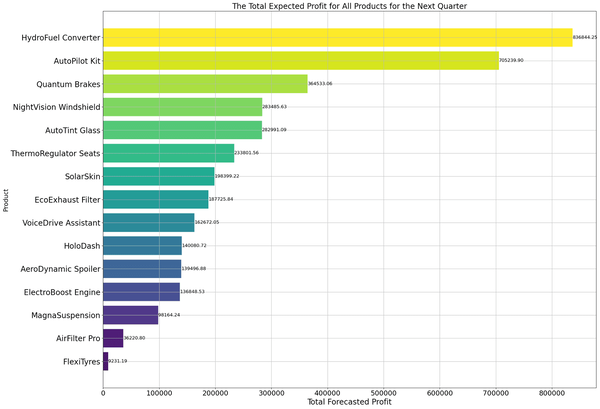
The total expected profit for all products for the next quarter.
-
The most profitable products for the next quarter. (Top 5 Products).
3) Determine the percentage of returned products and potential defects for each product.
-
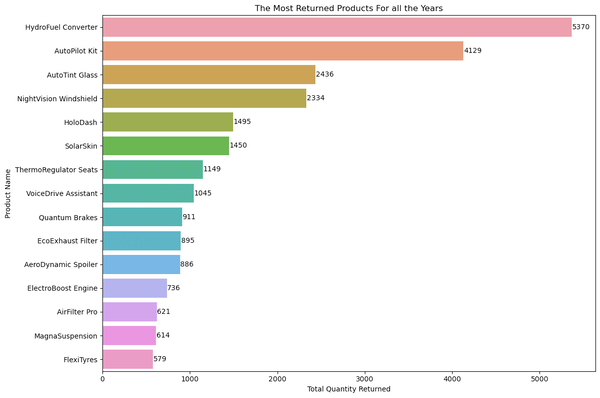
The Most Returned Products For All the Years.
-
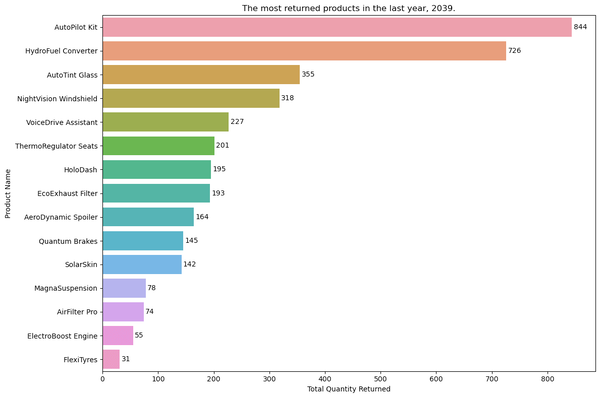
The most returned products in the last year, 2039.
-
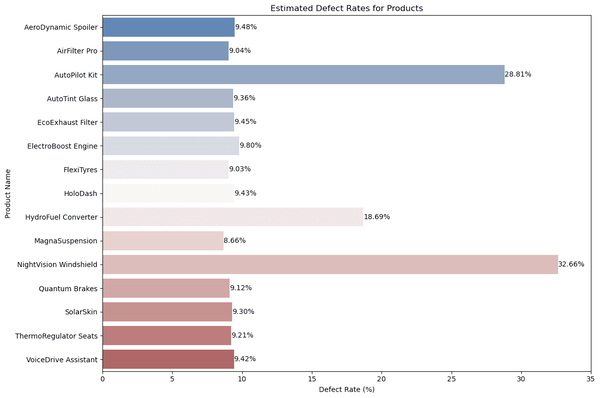
Estimated Defect Rates for Products.
4) To assess the efficiency of inventory management.
-
Forecasted Inventory Requirement for the First Two Months of Next Year.
Methodology
The analysis included data extraction using SQL queries and data cleaning to ensure accuracy. Analytical tools such as (MySQL, ChatGPT, Python, Pandas, matplotlib, seaborn, and Numpy) were used to perform in-depth analysis of sales, product, customer, and inventory data.
Data Collection and Preparation
The necessary data was extracted from the company's sales and inventory database. This includes sales numbers, order details, product names, and the start and end dates of the sale. It includes data cleaning, classification of sales according to requirements specified by the customer, and verification of inventory records.
Data Analysis Section
Sales Trends
-
Monthly Sales of Each Product Over Time.
Product Performance
-
Monthly Profit of Each Product Over Time.
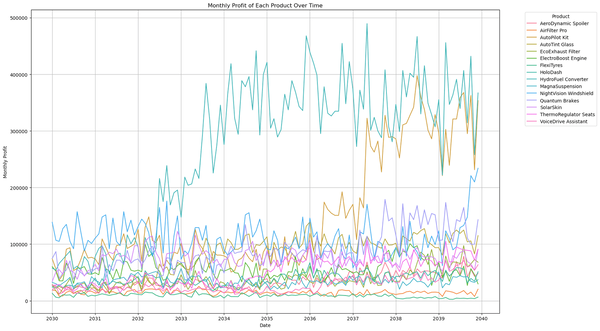
We also see a clear difference between the two charts because in the first, all sales were included, even returns, but in the second chart, only completed sales were counted.
-
Monthly Profit of Each Product Over Time (Completed Orders Only).
-
Monthly Gross Profit for (Hydro Fuel Converter) in 2039.
I analyzed one product for the last year to match the results with the previous chart for all products.
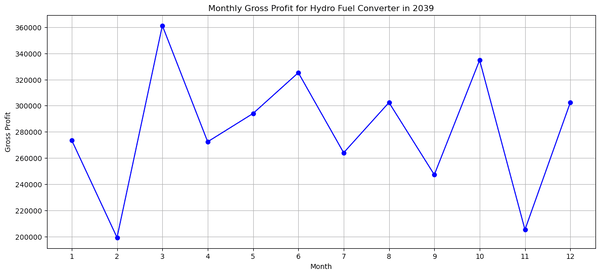
Below are the detailed monthly gross profits for the HydroFuel Converter in 2039:
-
Monthly Profit of Each Product Over Time in CSV file format.
Through this file, you can check the results in detail and compare them in numbers with previous charts.
Predictive analysis
Predictive analysis of data using sales history for the past year. Estimated analysis only. From this analysis, we conclude the sales pattern and which products will achieve the most profits and must be focused on and permanently available in stock.
-
The total expected profit for all products for the next quarter.
-
The most profitable products for the next quarter. (Top 5 Products).
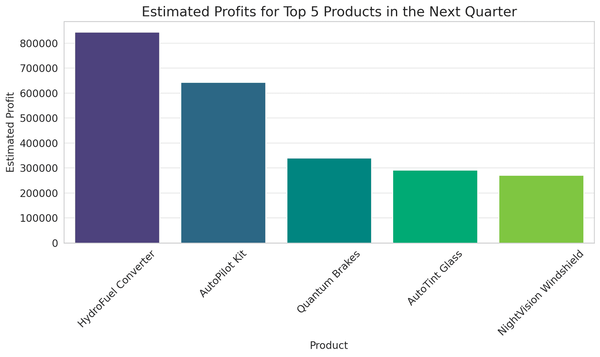
Here's a table displaying the estimated profits for the top 5 products for the upcoming quarter:
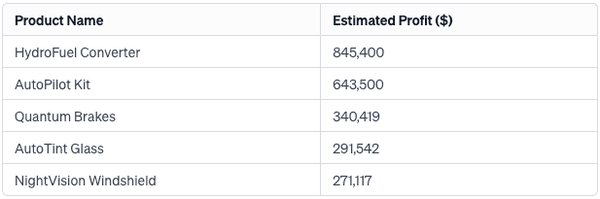
These estimates are based on the average monthly profits from the most recent year, extrapolated to the next quarter. Remember that these are projections and actual future profits may vary based on various factors.
Analysis of returned products and estimated defects
I suggest that notes should be made about the reasons for returning products and what problems there were in the product that led to its return, and an attempt should be made to avoid these problems to increase sales and gain trust among customers.
-
The most returned products in the last year, 2039.
-
Most Returned Products For All the Years.
-
Estimated Defect Rates for Products.
This analysis is only an estimate as the database does not have any field indicating the product defects or the reason behind the defects for each product. To address this, it is recommended to include a new field in the database that records details such as defective products, the date they were returned, and the reason for the defect of each product for more accurate analysis.
Inventory Analysis
Assuming that sales trends continue the following year as they are, how much product inventory would we need at the beginning of the year, to service the value of demand in the first two months?
-
Forecasted Inventory Requirement for the First Two Months of Next Year.
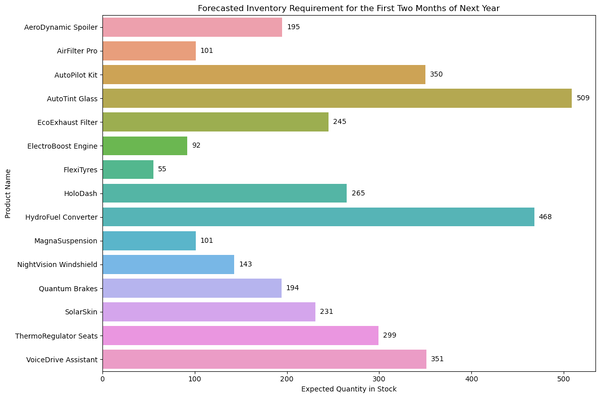
This analysis provides insight into which products to stock and which ones to avoid due to holding costs and frequent out-of-stocks.
Findings and Interpretation
-
Sales trends: The highest increase in sales of (Autopilot kits) for the product was observed during the specified period (Mid-year 2038).
-
Product Performance: The product (Hydrofuel converter) during the specified period (April 2037 and 2038) recorded the highest profits, which indicates the market's preference for this product.
-
Inventory analysis: Upon inventory analysis, it was found that certain items are overstocked, leading to increased holding costs, while others experience frequent stock-outs. Proper storage of products must be considered to match supply and demand.
Recommendations
-
Targeted Marketing: Focus on high-demand products during peak sales periods.
-
Inventory Optimization: Implement a just-in-time inventory system to reduce holding costs and avoid stock-outs.
-
Data-Driven Restocking: Use sales forecasts to guide inventory restocking decisions.
-
To improve the target results: all necessary information related to the products should be included in the database to adjust future analysis, for example (a table recording the individual defects of the products and the reason for return).
Conclusion
The analysis highlights significant opportunities for improving sales and inventory management strategies and avoiding problems resulting in returns. Implementing the recommended actions is likely to enhance operational efficiency and profitability.


